Dashboard For Purchased Car
Project Description
Stack: CSV . Excel · Power Query
This project analyzes customer demographics and behaviors related to car purchases. The raw data, sourced from a CSV file, included fields such as Marital Status, Gender, Income, Children, Education, Occupation, Home Ownership, Cars Owned, Commute Distance, Region, Age, and Purchased Bike. Using Excel and Power Query, I transformed and cleaned the dataset before building an interactive Excel dashboard.
What the dashboard shows
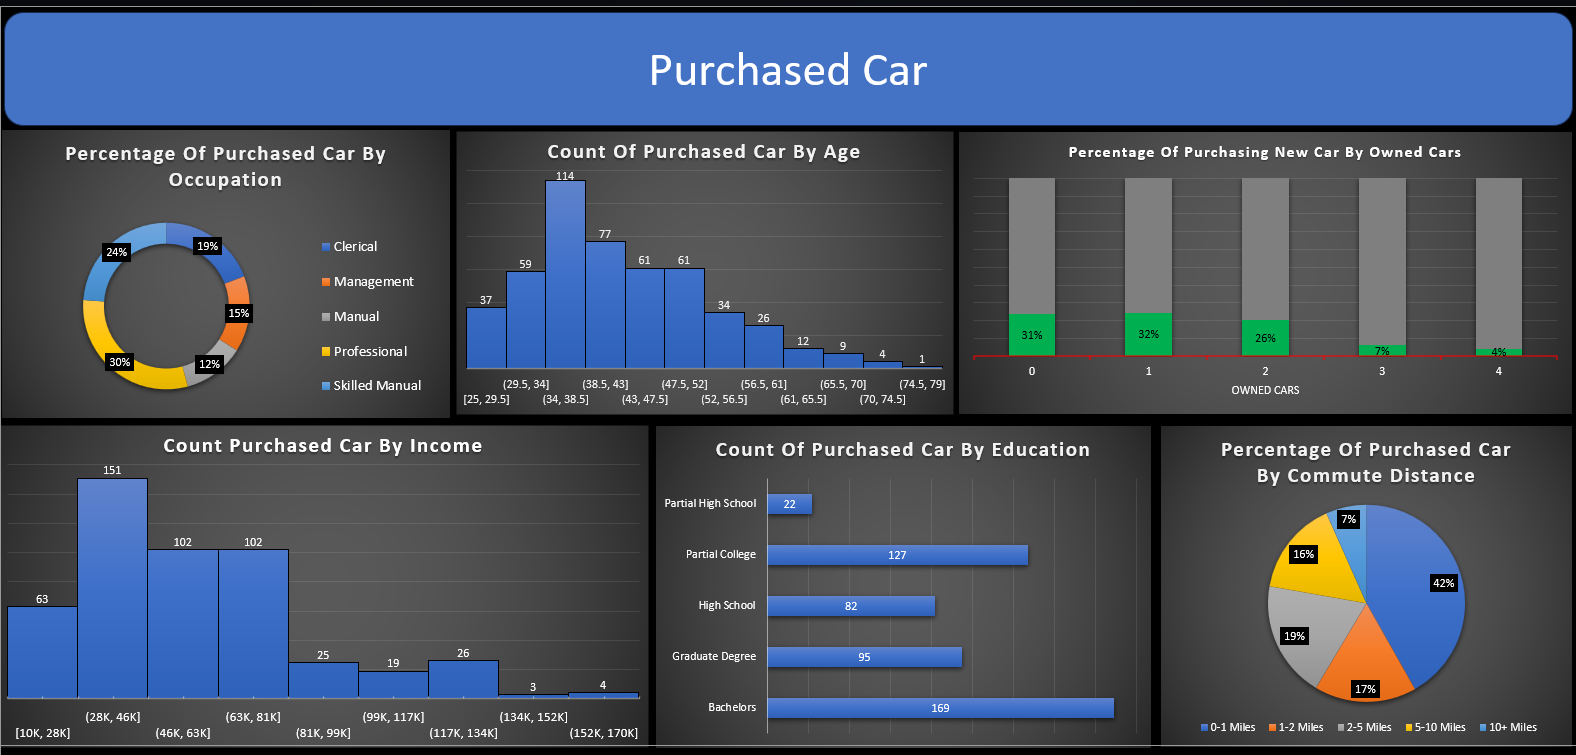
• Percentage of purchased cars by occupation (Clerical, Management, Manual, Professional, Skilled Manual).
• Distribution of car purchases by age groups, highlighting peak buying age between 30–45 years.
• Relationship between cars already owned and the likelihood of purchasing a new one.
• Car purchases by income brackets, showing clear correlation between middle-income groups and higher car purchases.
• Impact of education level on car ownership decisions (Bachelors, Graduate Degree, High School, etc.).
• Commute distance as a factor in car purchase behavior (0–1 miles, 1–2 miles, 5–10 miles, 10+ miles).
Outcome & value
The dashboard reveals how income, education, occupation, and commute distance influence car purchase decisions. It provides marketing and sales teams with actionable insights to segment customers more effectively, identify high-potential buyer groups, and design targeted promotional strategies.